Kubernetes monitoring with Grafana and Prometheus
The popularity of Docker is well established, as a recent Gartner study confirms: « By 2030, more than 70% of global enterprises will be running multiple containerised applications in production, compared to less than 20% in 2019 ».
To manage a growing number of containers, the use of orchestrators has appeared, allowing for greater speed, efficiency and budget, the infrastructure scales automatically according to needs, and integrates principles of high availability and load balancing, among others. This makes an infrastructure more resilient and more adapted to agile practices.
Among these orchestrators: Kubernetes, the most popular to date, the CNCF (Cloud Native Computing Foundation) announces « At present, 84% of companies use containers […]. The vast majority (78%) use Kubernetes to manage them ». To understand how Kubernetes dominates the market, the CNCF identified more than 109 tools for managing containers, 89% of which use and/or are based on Kubernetes.
The importance of containerisation and its orchestration in the infrastructure landscape highlights and enhances problems already present in more traditional infrastructures, including monitoring.
What is supervision ?
A simple definition would say that « Supervision is a computerised control and monitoring technique for automated processes ».
It is a « monitoring » method that aims to ensure the proper function of a product or infrastructure by collecting and combining different information that can be used to determine the operating state of the item that is being monitored.
Types of supervision
Passive supervision will be implemented by collecting logs, retrieving metrics and displaying them on a Grafana dashboard. This supervision will be accessible to anyone who has been granted access and can be consulted at any time.
On the other hand, active supervision will allow for better reactions and will take the form of alerts that can be configured through different channels (email, SMS, instant messaging, etc.) and will make it possible to inform critical state (based on criteria defined beforehand) to allow for rapid remediation of a degradation in the functioning of a product/infrastructure.
What are the interests ?
What is the resource consumption of our infrastructure ? Is it doing well ? Is the infrastructure well designed ? Is it well balanced ?
A well set up supervision allows us to answer these questions, passively (by consulting a web page or a report for example) but also actively (by receiving an email alert or other direct and fast means of communication).
Once this information is known, we can resize, parameterise and rebalance the infrastructure so that it is in the best possible shape and at a cost as close as possible to our needs.
The interest is therefore focused on the reaction in the event of an incident or malfunction, but also on decision support thanks to key information on the operation of the product being monitored.
Which tools?
There are many monitoring tools, Zabbix, PRTG, Datadog, OpManager, Nagios XI, SolarWind Monitor, etc.
Some of these tools are chargeable, some are owned, some are technology or tool specific and are not always compatible with others.
A tool, or rather a pair of tools, has been gaining in popularity over the last few years :
On one side Prometheus, a Serial Time Database (TSDB) that allows us to record all our metrics (measurement on the state of a component, CPU usage, number of requests, amount of RAM used, error rate, …) with a time aspect.
On the other hand, Grafana is a data aggregator and visualizer. It is fully configurable, many visualisations are available, as well as data sources (OpenTSDB, InfluxDB, Graphite, Loki, Elasticsearch, Tempo, Jaeger, MySQL, PSQL, etc.) of which Prometheus is a part.
Both tools are open source, which is a great advantage for some customers who do not want to depend on proprietary solutions.
This pairing is accompanied by a log aggregator (Graylog, for example), which allows logs to be centralised on a single platform and quickly linked. We can therefore quickly filter logs from dozens of different sources and identify the more precise causes of a possible failure.
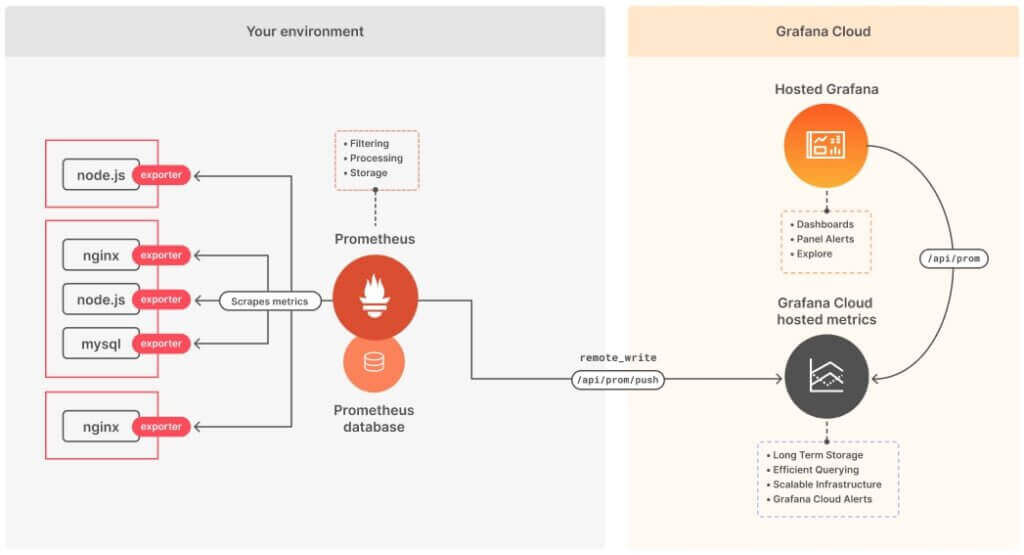
Prometheus works in conjunction with « exporters » which are small software bricks that display metrics on a web interface. Once these metrics are accessible from a web interface, Prometheus will « scrape » them, i.e. retrieve the data from itself and then save them in its database. This is a « pull » type of operation, unlike the « push » type where the software sends the information itself to the database. Each element to be supervised will have to integrate one of these bricks (often already existing and supported by the community) to be able to be taken in charge by Prometheus.
Features of Kubernetes
One of the big features of Kubernetes and containerisation in general is the non-persistence of containers (compute bricks), they can stop at any time (and restart immediately if Kubernetes decides to do so) which makes logs and other metrics very fragile, difficult to follow up on these data which can disappear from one moment to the next
The interest in setting up a supervision system is even greater when the number of containers is large. The data (logs and metrics) will be saved on « external » elements whose purpose is to keep this data.
The logs will be automatically redirected to the logging platform and thus kept by this particular instance with persistent storage.
Concerning the elements that need to be monitored via metrics, they will be automatically tagged at creation so that Prometheus (via an auto-discovery system) can go and interrogate them and record their metrics in its persistent storage.
The volatile aspect of Kubernetes can also cause problems in the event of a resource change, as the changes of state are rapid, the repercussions are immediate and their propagation is rapid. Active monitoring allows for immediate warning of such undesired behaviour and thus reduces degradation and possible service interruptions.
By Anthonin Presse.